The beverage industry is big and broad, including all sorts of non-alcoholic drinks like coffee, soda, tea, energy drinks and alcoholic drinks like beer and wine. Add it all up and the beverage industry is a multiple billion-dollar per year industry and expected to be a trillion dollar industry by 2024.
Industry growth is projected despite the current global pandemic since non-alcoholic beverages are considered to be essential goods and account to more than half of the total beverage market. We can probably say that the whole beverage market will be minimally impacted by the current health crisis affecting the whole world.
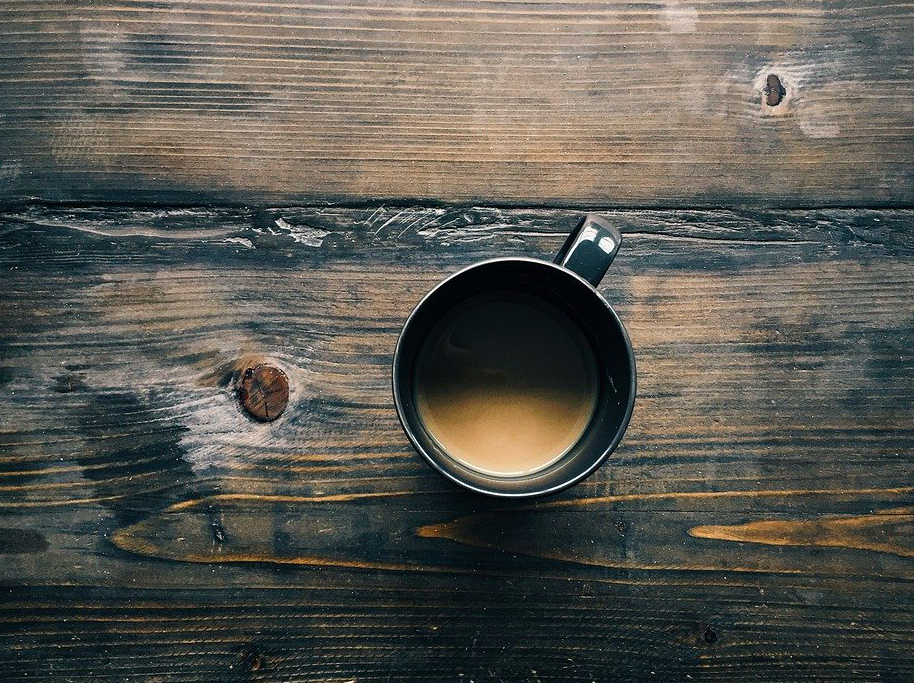
Coffee is only one segment of the overall beverage industry.
Beverages are generally classified into non-alcoholic and alcoholic. However, if you are going to get sub-branches of each category, you may expect to identify more further down the order, as beverages nowadyas have branched out from traditional types of beverages. Some new categories include the fermented Kombucha, which just recently branched out from the traditional tea, and the cold brew which was recently included in the coffee category.
In this industry review series, let us now have a look at some beverage statistics, facts, and trends to help you understand the direction of the beverage market.
Table of Contents:
Beverage Facts and Present Statistics
The beverage industry reports that as much as 50% of beverages sold in the market contain zero sugar, as the industry moves towards curtailing calorie intake by 20% by 2025. (NPR)
Ready-To-Drink (RTD) and cold brew consumption appeals more to the younger generation or those aged under 40. (Daily Coffee News)
The non-alcoholic beverage year-on-year revenue quarterly growth for the 1st quarter of 2020 is at 7.24% (CSI Market)
North America is the largest market for functional beverages. (Mordor Intelligence)
A typical adult can harmlessly ingest up to 400 mgs of caffeine per day (or about four 8 oz. cups of coffee). Consuming beyond that bring about calcium excretion, which may eventually lead to osteoporosis. (Eat This)
Kids and teenagers get around 17% of their calorie intake from added sugars, half of which come from sugary beverages. (NPR)
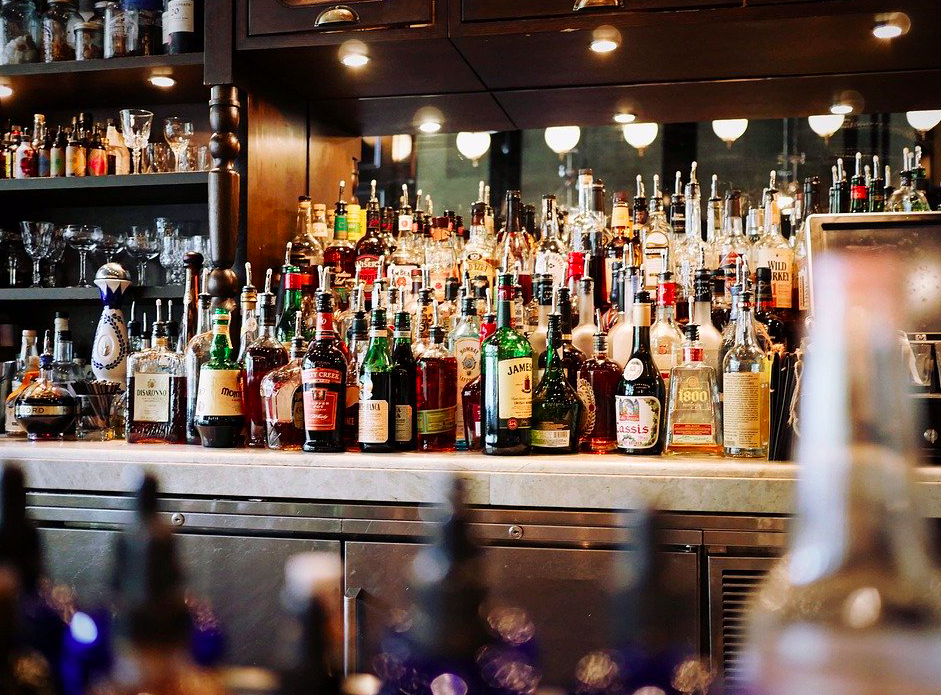
Ninety nine bottles of beer and alcohol on the wall.
PepsiCo, Inc., Coca-Cola, Heineken Holding NV, Diageo plc, Anheuser-Busch InBev NV are just some of the major suppliers in the global beverage market. (Research and Markets)
In its 2018 estimates, the U.S. beverage industry employs around 261,000 individuals in its workforce. (DataUSA.io)
The local fermented beverage supply quantity of Uganda increased by 4.5% in 2017 as compared to the previous year. (Nation Master)
According to a survey, 80% of adults (aged 18 and above) responded that they were aware of the cold brew beverage. (Daily Coffee News)
The lowest recorded year-on-year revenue growth was -9.61 % posted on the 4th quarter of 2017. (CSI Market)
According to Kantar Media, in 2018, the advertising expeditures for the beer industry amounted to $1.5 billion, the soft drink industry spent a close $1 billion, while the bottled water industry with $109 million. (The New York Times)
The highest revenue year on year growth for non-alcoholic beverages was recorded on the 2nd quarter of 2019 with 8.39% (CSI Market)
Bottled sweet teas such as Gold Peak’s Sweet Tea has 48 grams of sugar, which translates to about 96% of one’s daily value of added sugar, in a single serve bottle. If you gulp down a Large Sweet Tea at Sonic, be ready to take in about 78 grams of sugar which will surely shoot up your sugar levels. (Eat This)
The U.S. Beverage Industry
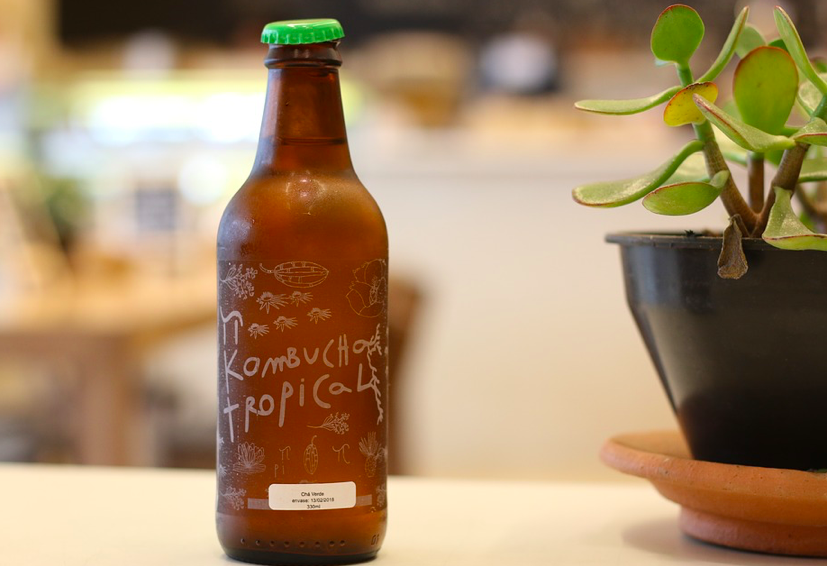
Kombucha is a growing segment of the beverage market.
According to a study made in 2015, 72 male respondents said that skim milk, full-fat milk, and orange juice kept them more hydrated than water did. (The New York Times)
The estimateed job growth rate in the beverage industry is 0.6% within a 10-year projection (pre-pandemic figures). (DataUSA.io)
Convenience store plays a key role in beverage promotion of new products. This sales channnel is particularly important in the sales of profitable and individual bottles which are a favorite among younger customers. (Packaged Facts)
As the heart association advocate for children to consume no more than 8 ounces per week, kids and teens in the country still consume around 150 calories/day on the average, or about 12 ounces/day. (NPR)
According to beverage consulting firm, Beverage Marketing Corporation, bottled water sales surged by 7% in 2017, unseating soft drink as the leading beverage in the country. Subsequently, bottled water sales has continued to rise. (The New York Times)
U.S. Alcohol Trends
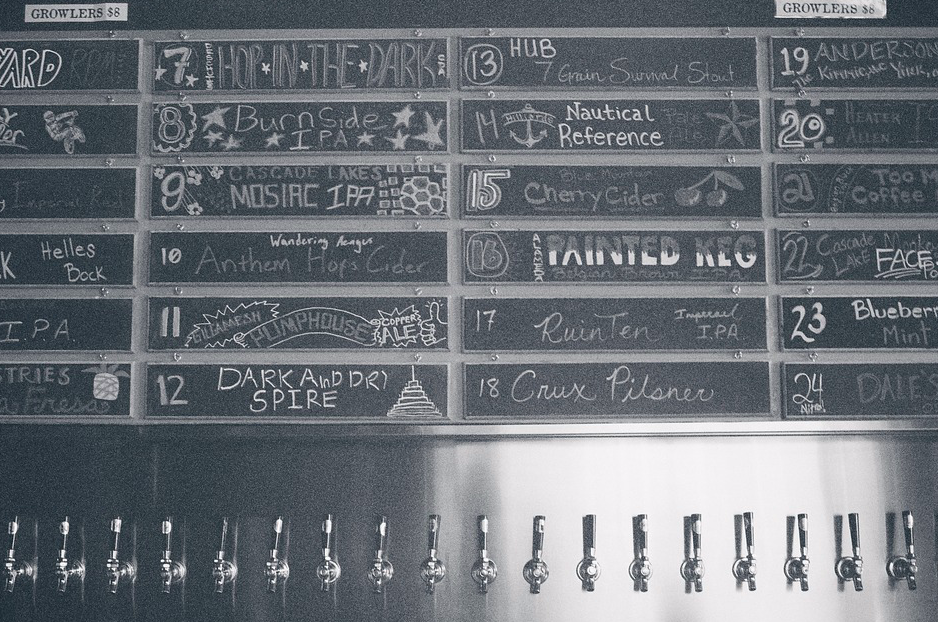
Craft beer sales have slowed… slightly.
- Enduring Brown Spirits – American whiskey continue to be popular among the populace. According to Beverage Information and Insights Group, whiskey hit 23.29 million 9-liter cases in 2018, a 5.3% jump from its previous figure. Brown spirits is at an opportune time, and won’t be slowing down soon. (Beverage Dynamics)
- Craft Beer Decline – The once surging brew seems to be simmering down a bit. Craft beer slowed down growth to 4-5% these past few years after posting double-digit growth during its outset, according to Brewers Association. Despite these single-digit gains, it continues to outperform the whole beer market which stayed at 1-2% growth. (Beverage Dynamics)
- Rosé(s) For You – Rosé wine has been up there with brown spirits with regards to posting remarkable sales. The rosé wine category marked a 48% growth in te past 12 months, while wine in general posted only 3% growth according to SGWS. (Beverage Dynamics)
In a 2017 Beverage Digest report, carbonated soft drinks sales in the country has declined for 11 consecutive years while consumption hit a 30-year low earlier this year. (Eat This)
The average age of a beverage employee in the United States is 39.7. (DataUSA.io)
Research have proven time and again, that carbonated soft drinks consumption is linked to obesity. Childhood obesity in the U.S. has doubled for the past 30 years. These findings compelled the industry to start producing low-calorie to zero calorie drinks like fruit beverages, bottled water, and functional beverages. (Grand View Research)
The NCA’s (National Coffee Association) annual report showed that 12% of coffee drinkers drank cold brew within the past week while 31% reported that they consumed RTDs either regularly or occasionally. (Daily Coffee News)
The average salary in the beverage industry is pegged at $59,054 (DataUSA.io)
Covid-19’s Initial Effects on the Local Alcoholic Beverage Industry
- The Covid-19 pandemic’s effect on the U.S. alcoholic beverage industry has been relatively unconventional compared to past recession fallout. Though the sales of alcoholic beverages have seen a spike in recent weeks, the effect has rather been irregular. Some beverage companies reported a surge in sales, while others reported losses on their end. (Forbes)
- In the week ending March 21, spirits sales spiked an estimated 50% according to a data released by the Republic National Distributing Company (RNDC) a major wines and spirits distributor. According to a Nielsen data, the national overall sales increase reached 55% for that week. (Forbes)
- However, RNDC reported that the sales increase rate declined by the last week of March although it maintained a 20%+ rate. Data showed a rise in 1.75 liter bottles sales compared to 375 ml bottles which showed a minimal increase. (Forbes)
Global Beverage Industry
The global beverage market was valued at $1,544.61 billion in 2018 and is expected to gain a CAGR of 3.1% to hit $1.86 trillion by the year 2024. (BusinessWire)
In 2018, the global beverage volume sales hit $906.1 billion. (Statista)
The major players in the non-alcoholic beverage market include, and in no particular order: The Kraft Heinz Company, The Coca-Cola Company, Snapple Group, Inc., Nestle S.A., Dr. Pepper, and PepsiCo, Inc. (Grand View Research)
Burkina Faso ranked 1st in Fermented Beverages Production in 2017. (Nation Master)
The fastest growing market for functional beverages is the Asia Pacific region. (Mordor Intelligence)
The global beverage sales share of packaged water was at 18% in 2018. (Statista)
Accelerated urbanization combined with shift in lifestlye as well as increasing expendable income has positioned the Asia Pacific region as an emerging market in the global beverage industry. (BusinessWire)
By 2024, the functional beverage market is expected to hit $208.13 billion with a CAGR of 8.66% throughout the forecast period of 2019 to 2024 (pre-pandemic figures). (PRNewswire)
Egypt ranked 28th in value added of food, beverages and tobacco with $6,623.45 Million last 2014, up from 37 the previous year. (Nation Master)
The demand for functional beverage driven by consumers’ preference for non-alcoholic drinks. People have started to choose fucntional beverages over carbonated soft drinks and juices. (Mordor Intelligence)
RTD tea’s adaptability makes the product attractive for beverage manufacturers to develop this beverage along with the growing health trend in the North American market. The popularity of invigorating water and RTD teas have elevated the demand for functional beverages around the world. (PRNewswire)
Industry Report: 59 Craft Brewing Industry Statistics and Trends
Healthier new products with zero sugar launched in the non-alcoholic beverage segment are expected to open new opportunities for market growth during the forecast period 2018 – 2024. (BusinessWire)
The global energy market has grown exponentially in the past few years. Energy drink consumption has increased among the age group 18-24 (34%) and 12-17 (approximately 31%). Red Bull, Monster Energy, and Rockstar are among the popular brands catering to these age groups. (PRNewswire)
Sake is not just popular in Japan according to industry reports that rice wine sales worldwide have soared over 22.2 billion yen in 2018 or around $205 million. This is the first time that rice wine global sales have breached the 20 billion yen mark.
Broad Industry Trends

Beer is seen to continue its dominance on the overall beverage market in terms of value. Propelling its growth are rising disposable income and alcoholic beverage drinkers affirmation towards the product. (Research and Markets)
Considering the hightened clamor for RTD energy drinks, coffee and tea, and relaxation drinks, functional beverages are becoming the fastest growing product in the beverage industry. (Grand View Research)
In 2018, the projected growth of the global beveraage sales was at 3.9% (Statista)
Using sweeteners and natural flavors to satisfy consumers demand for healthier as well as exotic beverages are some of the developing trends done by beverage companies having direct impact on the beverage industry. (Research and Markets)
Global Beverage Trends Influencing the Industry
- Convenience. Beer and soda used to be the only beverages which come in cans. Today, cocktails, hard seltzers, and canned wines have also became popular. This accesibility gave consumers the convenience of enjoying their favorite drinks, when and where they want it. And it’s not just alcoholic beverages, RTD cold-pressed juices as well as cold brew coffee are now sold in convenience stores which best fits their on-the-go, healthy lifestyle. (KPMG)
- Spotlight on Health and Wellness. Milennials are health conscious individuals, they are looking for healthful alternatives from carbonated sodas. Soft drink consumption has decreased these past few years, triggering beverage companies to venture into sparkling water drinks. Plant-based kombuchas and other functional beverages are also leading the way into giving consumers a healthier alternative. (KPMG)
- Viability. Consumers, especially the millenials, are turning into environment friendly packaging and this influences their decision making in purchasing a product. The beverage industry is heeding to these calls and are now offering eco-friendly packaging. Environment friendly paper boxes and aluminum cans are now being used to gradually replace single-use plastic bottles which are causing concern to most consumers. (KPMG)
Though difficult to specify and characterize, developing product mashups is just one of the opportunities some local beverage companies are looking into as it continues to please consumers. Kombucha, coffee sodas, fruit juice-infused sparkling water, plant-based energy drinks, and nitro cold brew coffee are some examples of these beverages. (Packaged Facts)
According to Drinks International, the Old Fashioned is the best-selling cocktail for 2019. This cocktail is considered the best seller among 30% of bars which it was sold. (LinchpinSEO)
Beverage Industry Trends Before the Pandemic
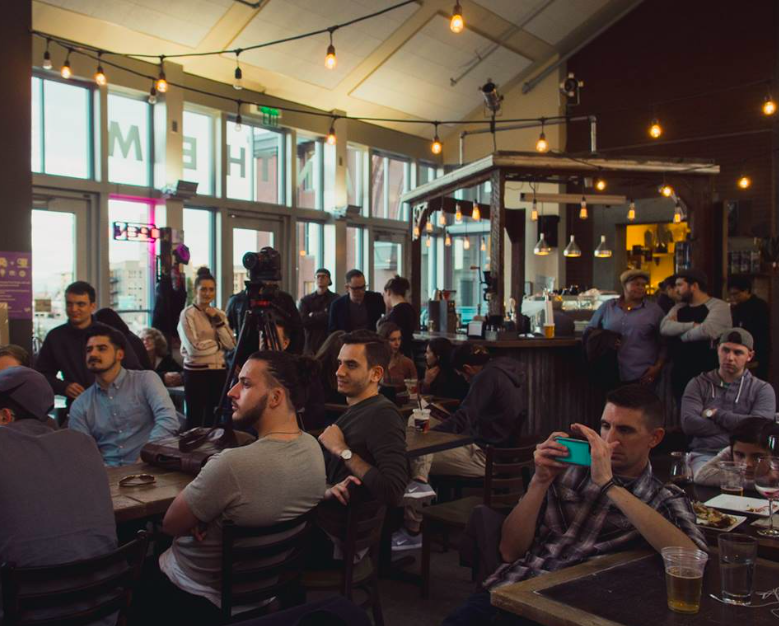
Customers gathering at a coffee shop.. pre-pandemic.
- Flavors of the World. Global flavors are set to influence current popular beverages such as tea, coffee, cocktails, RTDs, Juice, and other delightful drinks. Meyer lemon, blood orange, yuzu, and guava are some of the untapped flavors to watch out. (Beverage Daily)
- Plant-Based Beverages. Plant-Based commodities are highly regarded by consumers as viable and healthier options than animal-based products.This perception is currently carried over to beverages with plant-based creamers gaining traction on ordinary creamers. According to a report from Datassential, 83% of coffee drinkers consider using plant-based creamers while 34% actually use them regularly. (Beverage Daily)
- Color and Nostalgia. Color and benefits infused with contents is currently influencing the future of beverages. Matcha, blue algae, beet, purple tea, and butterfly pea flower tea are as nutritious and delightful to the sight as they are instagrammable. (Beverage Daily)
Convenience has been a major factor in beverage growth with manufacturers studying consumer behavior and patterns to better serve their target market. Single-serve RTDs work well with people on the move, while single-serve coffee pods greatly benefit people who don’t have time to mix a cup of coffee. More people today are on the go and don’t have time to sit on the table and prepare their breakfast. These situations have greatly affected traditional milk and juice carton sales in recent years.
According to Nielsen, the sales of RTD alcoholic beverages have increased by 597% as compared to 2018, which meant this drink is not slowing down anytime soon. Hard seltzer RTDs on the other hand have risen by 193% while canned were at 77.5%.
The future looks bright for this board category of consumer products. Further innovation and niching down for drink categories is expected to continue for the next decade among producers.
The post Market Update: 57 Beverage Industry Statistics and Growth Trends appeared first on https://foodtruckempire.com/.

